


How to Benchmark Your .NET Core Applications with Benchmark.NET

Performance is one of the most important aspects of any software application. No matter how good your features are, if your application is slow or unresponsive, your users will not be happy. That’s why it’s essential to measure and optimize the performance of your .NET Core applications using a reliable and accurate benchmarking tool.
In this article, I will show you how to use Benchmark.NET, a powerful and popular library that can transform your .NET methods into benchmarks and provide insights into the performance data. You will learn how to create, run, and analyze benchmarks with Benchmark.NET, as well as how to use some of its advanced features and options.
What is Benchmark.NET?
Benchmark.NET is an open-source library compatible with both .NET Framework and .NET Core applications that can convert your .NET methods into benchmarks, track their performance, and share reproducible measurement experiments. It’s no harder than writing unit tests!
Under the hood, Benchmark.NET performs a lot of magic that guarantees reliable and precise results thanks to the perfolizer statistical engine. Benchmark.NET protects you from common benchmarking mistakes and warns you if something is wrong with your benchmark design or obtained measurements.
The results are presented in a user-friendly form that highlights all the important facts about your experiment. Benchmark.NET also supports various export formats, such as markdown, csv, html, etc.
Benchmark.NET is already adopted by 16600+ GitHub projects including .NET Runtime, .NET Compiler, .NET Performance, and many others.
How to Install Benchmark.NET
To use Benchmark.NET in your .NET project, you need to install it as a NuGet package. You can do this either from Visual Studio or from the command line.
From Visual Studio, right-click on your project in the Solution Explorer and select Manage NuGet Packages. Then search for BenchmarkDotNet and install it.
From the command line, navigate to your project folder and run the following command:
dotnet add package BenchmarkDotNetHow to Create a Simple Benchmark
To create a simple benchmark with Benchmark.NET, you need to follow these steps:
Create a class that contains one or more methods that you want to benchmark. These methods should be public and have no parameters.
Decorate each method with the [Benchmark] attribute. This tells Benchmark.NET to treat these methods as benchmarks and measure their performance.
Optionally, you can also decorate the class with some attributes that define the configuration of the benchmarks, such as [SimpleJob], [MemoryDiagnoser], [RPlotExporter], etc.
Create an instance of the BenchmarkRunner class and pass the type of your benchmark class as a parameter to its Run method. This will run all the benchmarks in your class and generate a summary report.
For example, let’s say you want to compare the performance of two hashing algorithms: SHA256 and MD5. You can create a simple benchmark class like this:
using System.Security.Cryptography;
using BenchmarkDotNet.Attributes;
using BenchmarkDotNet.Running;

namespace HashBenchmark
{
    [SimpleJob(RuntimeMoniker.NetCoreApp31)]
    // Enable memory diagnostics
    [MemoryDiagnoser]
    // Export results as an R plot
    [RPlotExporter]
    public class HashBenchmark
    {
        private SHA256 sha256 = SHA256.Create();
        private MD5 md5 = MD5.Create();
        private byte[] data;

        // Define a parameter for the data size
        [Params(1000, 10000)]
        public int N;

        // Initialize the data before each benchmark
        [GlobalSetup]
        public void Setup()
        {
            data = new byte[N];
            new Random(42).NextBytes(data);
        }

        // Mark this method as a benchmark
        [Benchmark]
        public byte[] Sha256() => sha256.ComputeHash(data);

        // Mark this method as a benchmark
        [Benchmark]
        public byte[] Md5() => md5.ComputeHash(data);
    }

    class Program
    {
        static void Main(string[] args)
        {
            // Run the benchmarks
            var summary = BenchmarkRunner.Run<HashBenchmark>();
        }
    }
}
How to Run and Analyze Benchmarks
To run the benchmarks, you need to build and run your project in Release mode without attaching a debugger. You can do this either from Visual Studio or from the command line.
From Visual Studio, select Release from the Solution Configurations dropdown and press Ctrl+F5 to run the project without debugging.
From the command line, navigate to your project folder and run the following commands:
dotnet build -c Release
dotnet run -c Release --no-build --no-restore
After running the benchmarks, Benchmark.NET will generate a summary report in the console that looks something like this:
The summary report contains the following information:
The name and version of the benchmark library, the operating system, and the runtime used for the benchmarks
The name and parameters of each benchmark method
The mean time, error, standard deviation, and ratio of each benchmark method
The memory allocated and garbage collections performed by each benchmark method
You can use this information to compare the performance of different methods and identify potential bottlenecks or optimizations.
In addition to the summary report, Benchmark.NET also generates some files in the bin\Release\netcoreapp3.1\BenchmarkDotNet.Artifacts folder. These files include:
A markdown file with the summary report
A csv file with the raw data of the benchmarks
An html file with a detailed report of the benchmarks
An R script and a markdown file
You can open these files with your preferred tools and analyze them further.
For example, here is how it looks in a console window:
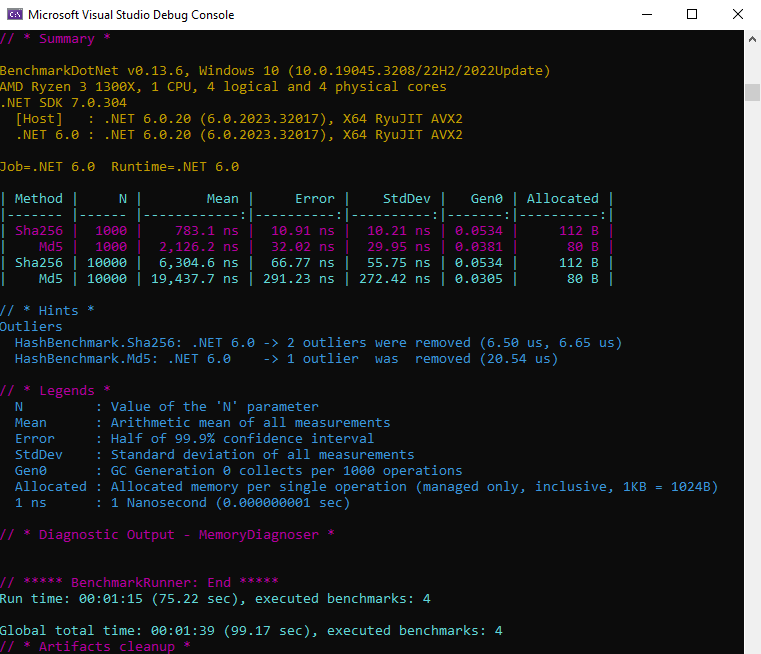
The chart shows the distribution of the measurements for each benchmark method.
How to Use Advanced Features of Benchmark.NET
Benchmark.NET offers many features and options that allow you to customize and configure your benchmarks. You can use various attributes and properties to define different aspects of your benchmarks, such as:
The number and duration of warmup, pilot, target, and idle iterations
The number and type of jobs, runtimes, platforms, and configurations
The type and level of statistics, diagnostics, analyzers, validators, and exporters
The type and format of columns, summaries, legends, and charts
You can also use some methods and classes to perform some actions before, after, or during your benchmarks, such as:
Setup and cleanup methods for global, iteration, or invocation scopes
Operations per invocation property for methods that perform multiple operations
Stopwatches and timers for measuring time intervals
ParamsSource attribute for defining custom parameters
You can find more information about these features and options in the official documentation: Getting Started
Conclusion
In this article, you learned how to use Benchmark.NET to measure and optimize the performance of your .NET Core applications. You learned how to create, run, and analyze simple benchmarks with Benchmark.NET, as well as how to use some of its advanced features and options.
Benchmarking is a vital skill for any software developer who cares about performance. By using Benchmark.NET, you can easily write reliable and accurate benchmarks that will help you improve your code quality and user satisfaction.